TradingView Advanced Charts + Web Workers: From Tick to Candle, Frontend and Backend
Bài này có bản tiếng Việt. Đọc bản tiếng Việt →

Nguyen Hai Trinh • Senior Software Engineer @ SmileViet
A blank chart screen. The candles were there — pretty, green and red, unmistakably TradingView. But the volume histogram underneath was wrong: a candle matched by a handful of trades showed volume as if it covered the whole session.
That’s the afternoon I remember most from the two months I spent building the chart for a derivatives trading platform in Vietnam — the project had exactly that much runway: two months to research, build, and ship to production. This post walks through the entire pipeline, from a tick leaving the exchange to a candle appearing on screen — both the frontend and the backend, because both sides create the bottleneck, and optimizing means both sides working together. The end of the post has a table of every improvement point with its concrete solution.
Pick the chart library before picking the architecture
The chart in every trader’s head is TradingView’s chart. The cheapest-looking path to that on your own platform is the free TradingView widget — an iframe from s.tradingview.tv, running five minutes after you paste the snippet.
But that iframe isn’t yours. The data is TradingView’s data, while our contracts are commodity derivatives listed on a central exchange — prices flow from the exchange, through an intermediary layer, before reaching the frontend. There’s no way to get that data inside TradingView’s iframe. For a trading platform, a chart isn’t just for looking — it’s where trades happen.
The realistic options around this problem:
- Free widget (
s.tradingview.tv): fastest to embed, but the data is uncontrollable and you can’t list your own instruments. Ruled out immediately. - lightweight-charts: open source, from TradingView itself, extremely light. But it only draws series — no toolbar, no built-in indicators, no drawing tools. Everything gets built by hand.
- KLineCharts (klinecharts.com): open source and goes much further than lightweight-charts — indicators and drawing tools included, and it loads data the same “you feed it” way. The indicators are real: dozens built in (MACD, BOLL, EMA, KDJ, RSI, CCI, DMI, SAR…), and custom ones via
registerIndicatorthat behave like built-ins. Philosophically it’s the open-source option closest to Advanced Charts. - TradingView Advanced Charts (
charting_library): commercial, self-hosted. The full TradingView charting UI ships inside your bundle. The price: the library is just a renderer, and every question it has about data comes to you through a JS API called the datafeed.
I chose Advanced Charts for two reasons. First, indicator depth: technical-analysis traders want hundreds of ready-made studies, and they want each one to behave exactly like it does on TradingView — KLineCharts has indicators, but anything beyond its built-ins falls back on you, and its extension ecosystem is much thinner. Second, muscle memory: a trader opens the chart and must immediately see “this is TradingView”. Rebuilding all of that on lightweight-charts would have burned both months on the chart alone. KLineCharts deserves a serious look when there’s no license budget — the first thing I’d check before committing is the list of built-in indicators.
Where Advanced Charts gets hard is exactly where the marketing stops: your data, your problem. Both cooks.
The whole pipeline: three roads for data
You construct the widget with a config object, and datafeed is the object you wrote:
tvWidgetRef.current = new window.TradingView.widget({
  symbol,                       // instrument code
  datafeed: customDataFeed({ /* deps */ }),
  library_path: "/charting_library/charting_library/",
  interval: savedResolution,    // read from localStorage, defaults to "60"
  timezone: "Asia/Ho_Chi_Minh",
  // ... enabled_features, disabled_features, studies_overrides
});
From that moment, the widget constantly interrogates your datafeed. Data reaches the chart through three roads, each with its own personality:
flowchart LR
  subgraph FE["Frontend React"]
    TV["TradingView widget"]
    DF["custom datafeed"]
    W["fetchHistoricalData.worker"]
    SOCK["socket.io /price-feed"]
  end
  subgraph BE["Backend"]
    GQL["GraphQL service"]
    PS["Price feed service"]
  end

  TV -- "getBars with from/to" --> DF
  DF -- "postMessage request" --> W
  W -- "paginated fetch" --> GQL
  W -- "postMessage full candle set" --> DF
  DF -- "onHistoryCallback bars" --> TV
  SOCK -- "nano-price-update, continuous" --> DF
  DF -- "onRealtimeCallback bar" --> TV
History goes through a Web Worker because it’s heavy. Realtime ticks go through a socket because they need to be fast. The two streams meet in exactly one place: the datafeed — which decides what enters the chart, when, and in what shape.
The datafeed: a contract with the widget
The datafeed is an object with a set of callbacks that TV calls in the order it needs: onReady, searchSymbols, resolveSymbol, getBars, subscribeBars. Miss one or return the wrong shape and the chart doesn’t error — it goes silent, or shows “no data”, and you debug blind.
resolveSymbol declares “what this instrument looks like” — and for derivatives it differs from stocks in a few places:
resolveSymbol: (name, ok, err) => {
  ok({
    name,
    description: contractName,
    session: "24x7",                  // derivatives trade almost continuously
    timezone: "Asia/Ho_Chi_Minh",
    exchange: "ACM",
    minmov: 1,
    pricescale: 1000,                 // tick size 0.001
    has_intraday: true,
    has_weekly_and_monthly: false,    // don't build weekly from daily — there is no daily
    supported_resolutions: ["1", "5", "15", "30", "60", "240", "1D"],
    data_status: "streaming",
  });
};
has_weekly_and_monthly: false is a decision I got wrong once: with it enabled, TV aggregates 1D candles into 1W on its own — but the backend only has daily data, so the weekly candles sag in a way nobody could explain.
As for getBars, TV works viewport-driven: on open it asks for the range on screen, and only when you pan into the left edge does it ask for older data. My code interferes with that rhythm in one place — the first call always fetches from the true beginning of the dataset:
// TV calls getBars with from/to in SECONDS. The backend wants ISO UTC.
if (!fromSec || !toSec || !dataFetched) {
  from = dayjs("2025-07-30 00:00:00").utc().toISOString();  // true data start
  to   = dayjs().utc().toISOString();
} else {
  from = dayjs.unix(fromSec).utc().toISOString();
  to   = dayjs.unix(toSec).utc().toISOString();
}
The full-range fetch on the first call is a deliberate trade-off: TV learns the data boundaries, and panning back is smooth because everything has already arrived. Its cost comes back later — and it’s one of the main optimization points.
Web Workers: fetching tens of thousands of candles without freezing the UI
An active contract during a session can return tens of thousands of candles for the 1-minute view. JSON.parse on payloads that size, plus mapping into objects and sorting by timestamp — enough to make the main thread visibly stutter while the chart is still drawing.
The fix: push the entire GraphQL connection into a worker. The worker is created as a module right inside the datafeed, running its pagination loop to the end of the data:
let page = 1, hasNextPage = true, allData = [];

while (hasNextPage) {
  const res = await fetch(GRAPHQL_ENDPOINT, {
    method: "POST",
    headers: { "Content-Type": "application/json",
               Authorization: `Bearer ${TOKEN}` },
    body: JSON.stringify({ query, variables: {
      filter: { instrumentCode: symbol, interval,
                eventTimestampFrom: from, eventTimestampTo: to },
      pagination: { limit: pageSize, page },
    }}),
  });

  const payload = (await res.json()).data.getHistoricalPricesByInterval;
  allData = [...allData, ...payload.edges];
  hasNextPage = payload.pageInfo.hasNextPage;
  page++;
}

self.postMessage({ candleData: allData, isComplete: true, error: null });
The worker fetches, parses JSON, and merges pages by itself. The main thread receives a single message containing the complete array. The chart stays smooth through the whole load.
A worker also carries concerns that aren’t data parsing:
- Auth expiring mid-session — the worker inspects GraphQL errors and flags
authError: trueon messages like “Invalid or expired”. The main thread sees the flag, shows a toast, clears storage, redirects to login. - Retries with backoff — up to 3 attempts, waiting
1000 * retryCountms between them. - Re-login from another tab — the datafeed listens to the
storageevent and refetches whenACCESS_TOKENchanges.
Volume: the backend returns cumulative, the chart needs per-candle
This was the biggest time sink, and the part with the least documentation.
The backend stores volume as cumulative: the 09:05 candle holds total matched volume from session open through 09:05, not the volume of the 09:05–09:10 bucket. The chart needs the latter. Per-candle volume has to be computed:
// only trust the subtraction when the next candle is exactly one interval away
if (next && dayjs.utc(next.eventTimestamp).valueOf() - ts === intervalMs) {
  actual = Math.max(0, parseVolume(next.volume) - parseVolume(c.volume));
}
The rule: only subtract when the next candle sits exactly one interval away. If there’s a gap (no trades in a bucket), the difference lies — so fall back to the previously computed volume for that bucket, or minimum 1 so the candle doesn’t vanish. One more filter before the loop: drop candles timestamped in the future by Vietnam time, because the server occasionally returns “future” candles due to how it snaps timestamps.
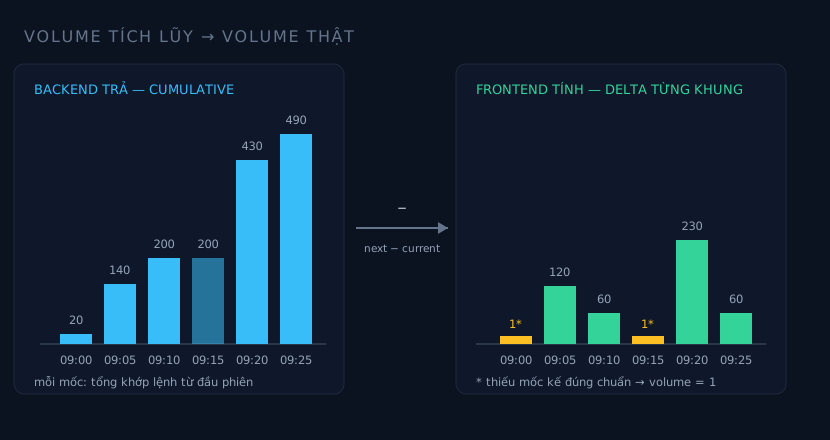
The left columns are raw data from the backend (monotonically rising), the right columns are real volume after differencing. Every missing next-point drops to minimum volume.
Timezone was the accelerant. The backend returns ISO UTC, the session runs on Asia/Ho_Chi_Minh, and “now” must be the user’s now. One evening went to a bug caused by comparing dayjs(c.eventTimestamp) against dayjs() in two different zones. Since then, every time comparison in this module goes explicitly through dayjs.utc(...).tz("Asia/Ho_Chi_Minh").
Realtime: fitting ticks into the candle that’s still open
Once history is loaded, the harder part starts: the server pushes prices continuously over a socket.io /price-feed namespace:
sequenceDiagram
  participant FE as ChartPrice component
  participant SK as socket.io
  participant TV as TradingView datafeed

  FE->>SK: emit subscribe-price (contractCode)
  loop every tick
    SK-->>FE: nano-price-update (lastPrice, tradingVolume)
    FE->>FE: updateCurrentBar (bucket by resolution)
    FE->>TV: realtimeCallbackRef with new bar
    TV->>TV: repaint last candle
  end
Each tick doesn’t go straight into the chart. It has to reshape the candle the current timeframe owns — a tick at 09:07:23 on the 5-minute view belongs to the 09:05 bucket — then merge: close is the latest price, high/low expand if the tick breaches them, and volume is the difference between the current cumulative tradingVolume and the initialVolume captured when the bar opened.
Plus a guard I only added after TV started drawing candles that traveled backwards in time:
if (existingBar && barTime <= existingBar.time) {
  console.warn(`Time violation prevented: ${barTime} <= ${existingBar.time}`);
  return currentTime;   // no bar may move backwards
}
The server occasionally pushes ticks out of order (retries, clock skew). TradingView is strict about this: a new bar with a time smaller than the previous one draws wrong or gets dropped. This guard doesn’t fix the data — it just keeps the chart from breaking.
Across the river: how the backend cooks candles
That’s the frontend covered. Now lift the hatch on the backend side — where the datafeed’s calls land. This is the part I couldn’t see while writing frontend code; I only saw it when reviewing both ends together.
The instrument_historical_prices table stores raw ticks — one row per price message from the exchange: last_price, trading_volume, timestamps. There’s a composite index on (instrument_code, event_timestamp), done right. The problem isn’t a table missing its indexes. The problem is that the table only has ticks, no candles.
Every getHistoricalPricesByInterval request travels this road:
sequenceDiagram
  participant W as Worker (FE)
  participant R as GraphQL resolver
  participant DB as raw tick table
  participant N as Node — aggregate in RAM

  W->>R: page 1 (limit 1000)
  R->>DB: SELECT all ticks in range
  DB-->>N: every tick row into memory
  N->>N: group by interval, compute OHLC in RAM
  N-->>W: first 1000 candles

  W->>R: page 2
  R->>DB: SELECT all ticks again
  N->>N: aggregate again from scratch
  N-->>W: next 1000 candles

  Note over DB,N: every page rescans and recooks everything
Three details worth their weight:
- No pagination at the DB layer.
getAllHistoricalPricesskips pagination and pulls every tick in the range into Node — the code comments itself withWARNING: Use with caution - can return large datasets. Only then does it slice in RAM to serve one page. - Hand-rolled aggregation in JS. Group ticks into buckets,
Math.max/Math.minfor high/low, first/lastlastPricefor open/close. Fine for small ranges. For 2.5 months of 1-minute ticks, every request is a Node memory-and-CPU meal. - The cumulative volume is born here. A candle’s
volumeis thetradingVolumeof the last tick in its bucket — that is, cumulative volume from session open. The delta computation on the frontend above is a direct consequence of this design.
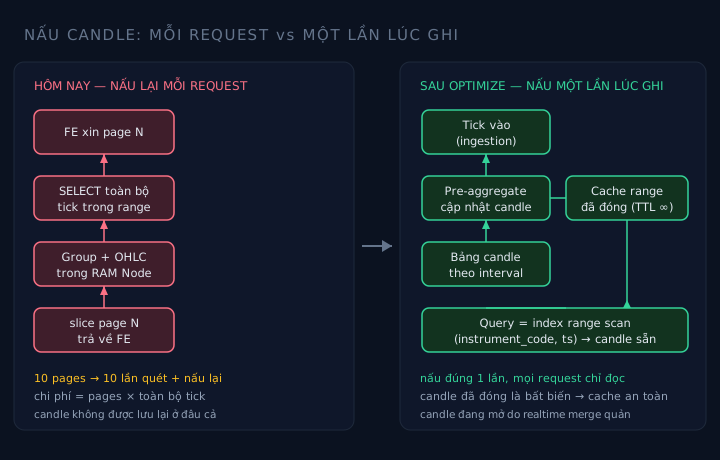
And the devil’s multiplication: the worker splits data into 10 pages, so the backend rescans and recooks everything 10 times. The cost of one chart load multiplies by page count, it doesn’t add.
The key insight for both sides: a closed candle is immutable
This is the one observation that benefits frontend and backend alike.
A 09:05 candle on the 5-minute view, once its bucket closes, never changes again. The only candle that keeps changing is today’s live one — and the realtime merge already owns that. From this single property, the optimization strategy on both sides becomes one strategy:
- Frontend: cache every closed candle in a worker store with
coverage(the ranges already held). WhengetBarsasks for a range, fetch only the missing gaps. - Backend: never recook a closed candle per request. Pre-aggregate once at write time — as ticks arrive, update the candle table per interval — so a query becomes an index range scan. Add a cache for closed ranges with an infinite TTL, because they’re immutable.
flowchart LR
  subgraph FE["Frontend"]
    TV["TradingView widget"]
    DF["datafeed"]
    ST["Worker store + coverage"]
  end
  subgraph BE["Backend"]
    ING["Tick ingestion"]
    PRE["Pre-aggregate at write"]
    CDB["Candle table per interval"]
    RC["Closed-range cache"]
  end

  TV -- "getBars" --> DF
  DF -- "ask for missing gaps" --> ST
  ST -- "miss goes to network" --> RC
  RC -- "hit: answer immediately" --> ST
  RC -- "miss" --> CDB
  ING --> PRE --> CDB
  ST -- "postMessage bars" --> DF
  DF -- "onRealtimeCallback" --> TV
The contract between the two sides stays small: the backend answers the exact range requested plus the true data boundary (the noData edge); the frontend gap-fills from lastCachedTimestamp → now on every socket reconnect, since that’s the only window where new “past” data can appear. The split of “worker for history until yesterday, Apollo for today” dissolves on its own — the worker owns all candles, and Apollo only serves the order book and other UI.
Improvement points and solutions
Everything both ends of the pipeline are paying for today, with concrete solutions:
| # | Problem | Side | Solution | Priority |
|---|---|---|---|---|
| 1 | Hand-rolled candle aggregation in Node, once per request | BE | Pre-aggregate at write — a candle table per interval or a materialized view; queries become index range scans | High |
| 2 | Offset pagination: every page rescans from the start | BE | Keyset/cursor pagination on (instrument_code, event_timestamp) | High |
| 3 | ISO-string payloads, bloated JSON | BE | Return epoch millis; consider columnar encoding or gzip | Medium |
| 4 | No cache for closed ranges | BE | Cache layer keyed by (symbol, interval, bucket) — immutable, so infinite TTL | Medium |
| 5 | No cache layer under the datafeed | FE | Worker store + coverage, fetch only gaps, return { noData: true } at the true edge | High |
| 6 | Race on fast symbol switches | FE | Generation ID + AbortController in the worker | Medium |
| 7 | Volume calc on the main thread | FE | Move into the worker, return a transferable Float64Array | Medium |
| 8 | One re-render per tick | FE | Throttle ~100ms or batch the tick stream | Medium |
| 9 | Two data paths (worker history + Apollo for today) | Both | Worker owns all candles; gap-fill after reconnect; Apollo only for other UI | High |
| 10 | dayjs parsing in the hot path | FE | Accept epoch from the backend, parse with Date.parse | Low |
Read the table by priority column and the work order becomes clear: #1 and #2 on the backend pay back fastest, because they multiply every request the frontend makes today. #5 and #9 on the frontend depend on the contract in #1 — fix the backend first and the frontend cache has something to lean on.
Closing
The chart runs in production now. Its users mostly don’t know that behind every green candle there’s a worker quietly assembling several GraphQL pages, one volume subtraction, and a guard against time-traveling ticks — and behind that, a Node process recooking the entire tick history for every page request.
Me, I still look at the volume column first every time I open the chart. When it stands there neatly, candle by candle, I can trust the rest is running correctly.
Two months wasn’t enough to make everything right. But it was enough to see precisely what’s wrong, on both ends — that’s the part I’m keeping for next time.
Keep reading
Need a developer for a contract or freelance project?
I take on fullstack projects — Go backends, React/Next.js frontends, or both ends. Send a few lines about the scope and timeline and I'll reply within 48 hours.